The
Nominal Cost of Standby
Nick
Bradbury
Kevin Lisowski
Background
On the job one day we wondered about how much
power a computer system uses while in “sleep” mode.
The
question was intriguing from a work-related view and from the viewpoint
of paying utilities customers in our own homes. We decided to
find out.
Setting
On the test bench we had an isolated power
supply, a 17” CRT monitor, a 15” LCD display, a
Dell brand
PC (tower), and an Apple iMac. The plan was to test each
device
separately to accurately display the results and, hopefully, to
demonstrate various cost-saving measures. The specific
details of
each device will be listed following the test results for those wishing
to make their own comparisons.
Testing
The displays (and iMac) were tested as
follows:
•
Off
• No signal
• Default Desktop
• Black Desktop
• White Desktop
The PC tower:
•
Off
• Sleep/Suspend
• Idle/On
• Under Benchmark utility
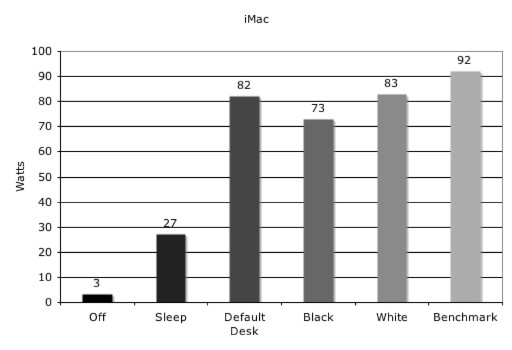
The iMac underwent the same tests as the
independent
displays with the addition of a benchmarking utility to directly
compare with the PC.
All tests were conducted with a regulated supply of 115 volts.
Results
Conclusions
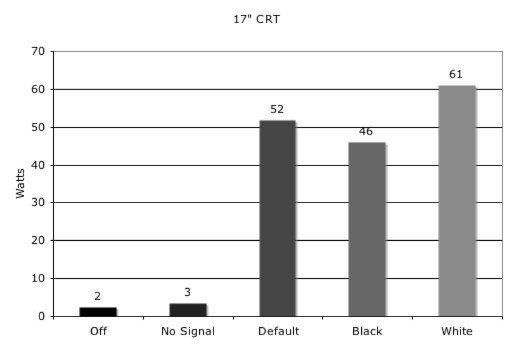
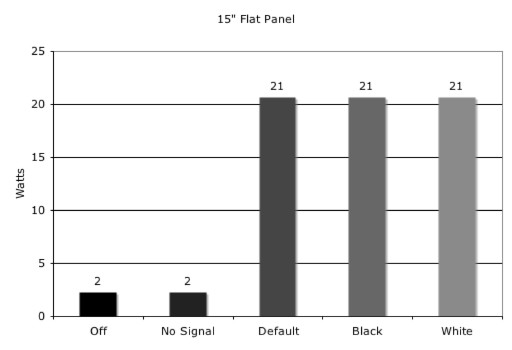
The 17” CRT had minimal draw in both
the “Off” and “No Signal” tests
and roughly two
times the consumption rate of the 15” flat panel in the other
tests. We noted that the choice of background color made a
significant impact on power consumption in the CRT models due to the
increased activity in the electron guns drawing the display.
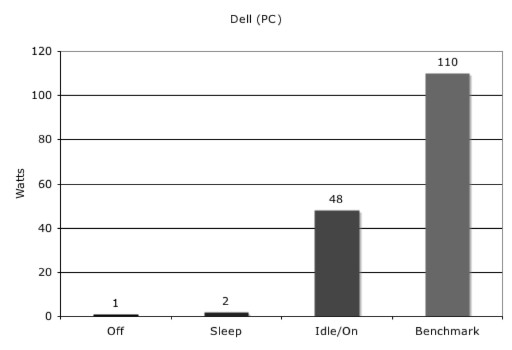
A severe disparity was present when
comparing under
benchmarking loads between the iMac and the PC (when factoring in the
addition of a CRT monitor).
Neither system experienced significant
draw while in
a Sleep/Suspend mode, however there was a notable lack of effect by
placing the systems in a “ready” state, i.e.
standby or
idle mode. The amount of change between an active and
standby/idle mode were too minimal to even warrant a plot on the charts.
Further gains could be made by managing
disk and
display activity when the system is unattended for a given period of
time.
We chose these systems out of what was
readily
available to us for testing and find them to be a reasonable
approximation of the “average” home
user’s equipment.
Additional
Questions
Some questions yet unanswered:
•
How much does
it cost per day to leave our systems on?
• How long would it take for a
LCD display to
“pay for itself” from power economy?
• What impact do these results
have on our
workplace?
Specifications
of Test Equipment and
Systems
Dell
Optiplex
GX260
Apple
iMac
1.7 GHz
Celeron
400 MHz PowerPC G3
256 MB RAM
256 MB RAM
Onboard Video
Dell
Branded
Monitor
Sencore PR750
Basic 17”
model
Variable Isolation
Transformer
Update:
Checking
into the practical application of
this testing we got the rates for (residential) power and
delivery. Those rates are $0.030349 for power and $0.027219
for
delivery totaling $0.057568 per kW hour. Using the test
results
as an approximation of Kevin's home system he determined it would cost
roughly $0.14 a day to let his system idle.

Last
Updated: 8 April 2005